Reading a Stack Trace as a Non-Engineer
Learn the four-part structure and pull out what engineers need instantly.
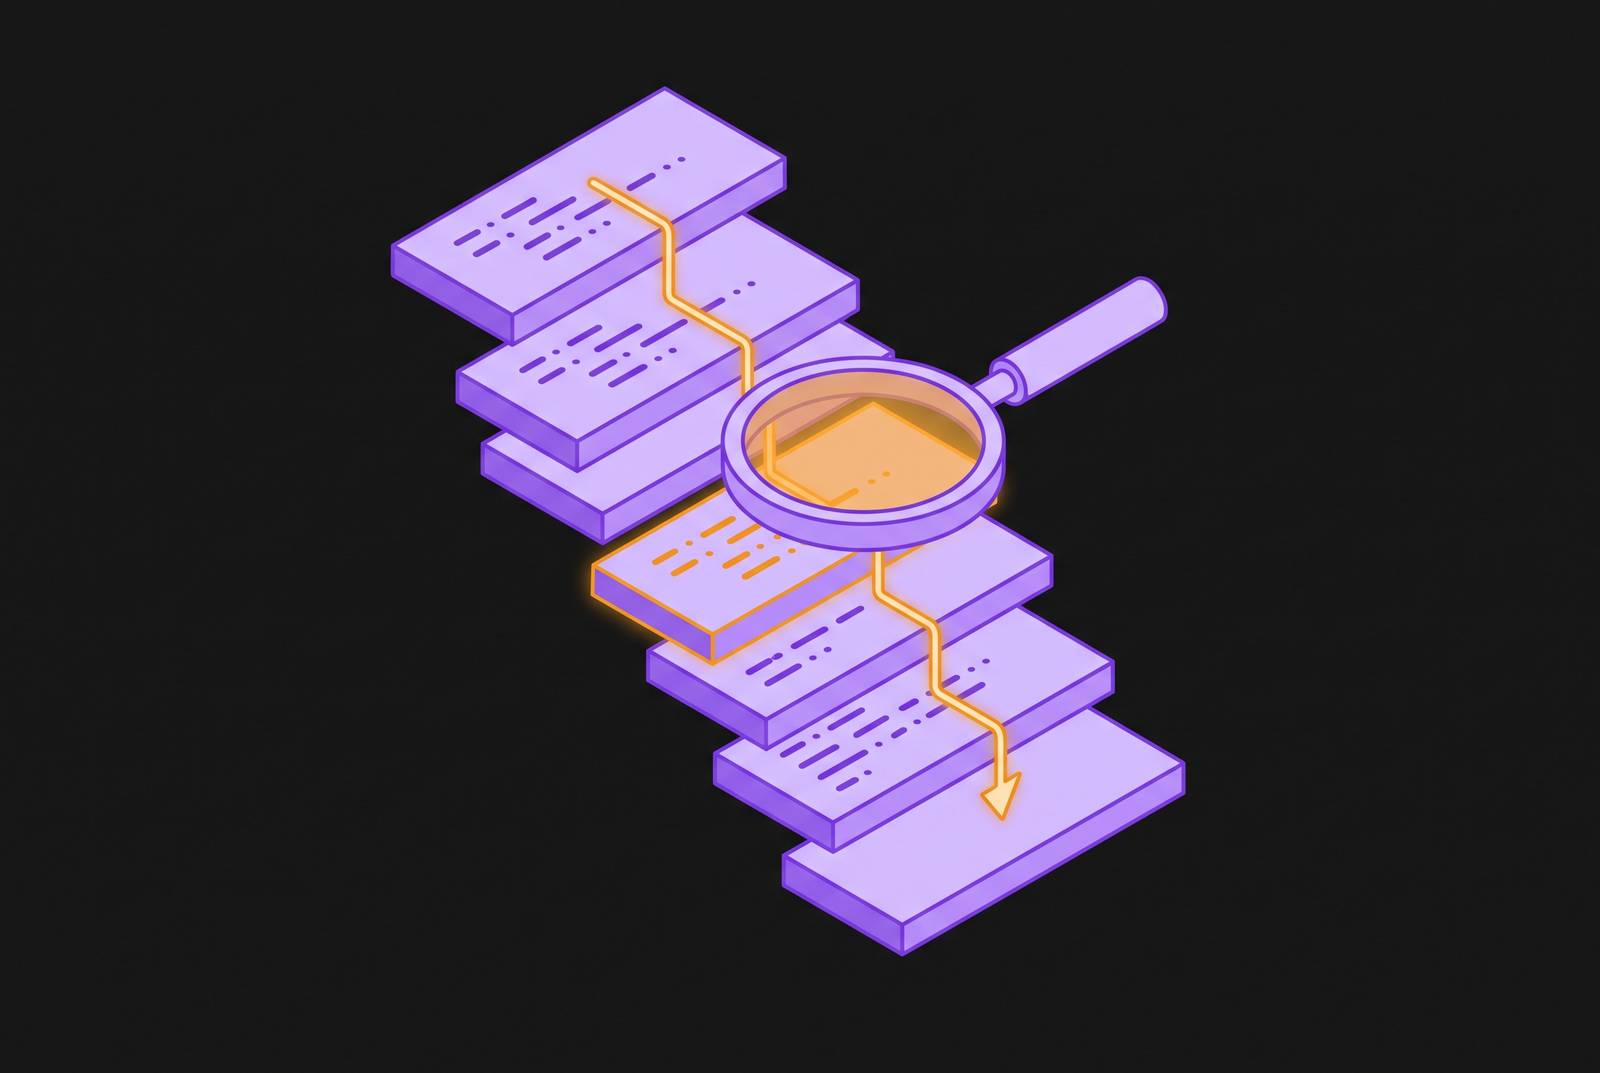
A stack trace is not random noise. It's a report, generated the instant a program breaks, and it follows the same four-part structure every single time, in every language. Once you know what to look for, you can pull out what an engineer needs without pinging anyone, guessing, or staring at the screen like it just insulted your mother.
What a stack trace is and where it comes from
Here's the plain version: a stack trace is a record of every function call that was active the moment a program hit an error. Nothing more mystical than that.
Think of function calls like a stack of plates at a diner buffet. Each new call goes on top. Each one that finishes comes back off. When the program crashes, the whole pile gets frozen mid-stack and printed out, top to bottom, so someone can see what was sitting where when the kitchen caught fire.
That's really the whole metaphor. It's a crime scene report: the trace shows the sequence of events leading up to the crash, with the newest event at the top and the oldest at the bottom. Most non-engineers run into these inside a Slack alert, an error monitoring dashboard, or a bug ticket that someone else filed and abandoned. Rarely does a marketer or PM open this thing inside an actual code editor.
Some languages hand you the trace automatically. Java and Python will print one the moment an error goes unhandled. Other languages need a developer to ask for it explicitly. Either way, the trace is not a diary of everything the program has ever done. It's a single photograph, taken at the worst possible moment.
The trace shows where the error surfaced, not necessarily where it started. The actual root cause might be several calls earlier in the chain. That's why reading the whole thing, instead of just the top line, matters.
The four parts of every stack trace, named and explained
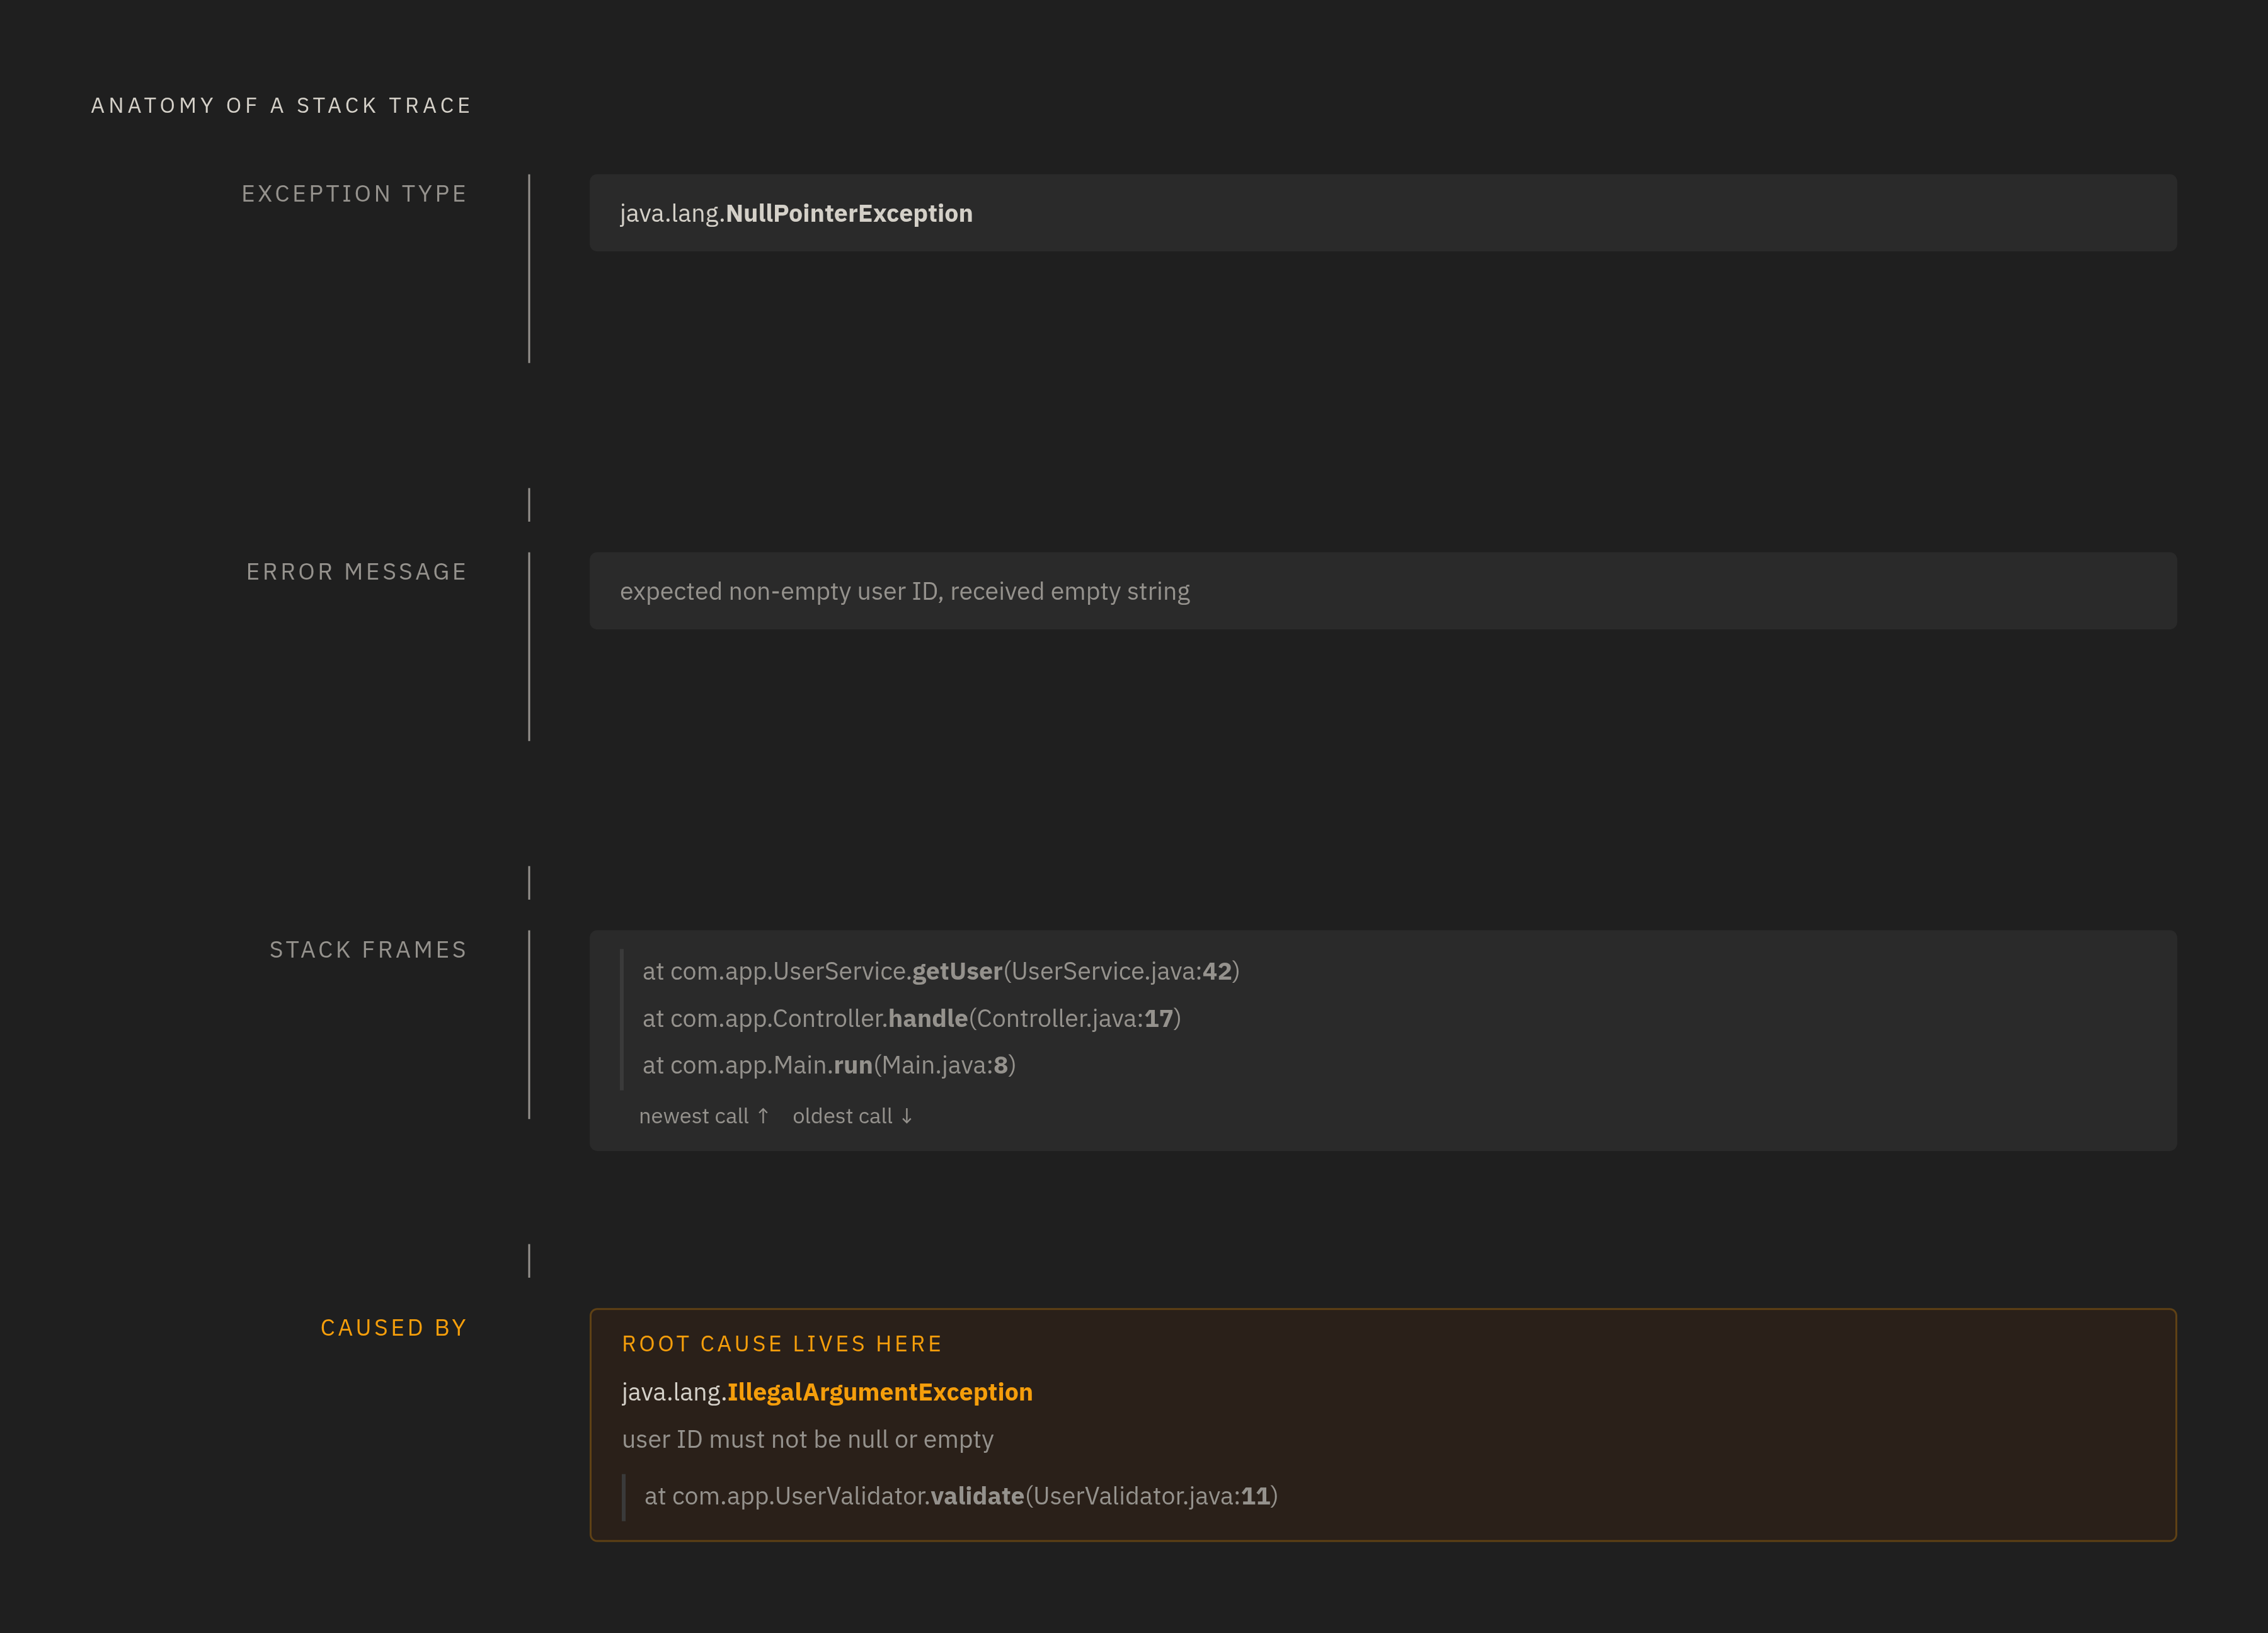
Every stack trace, regardless of what language it's written in, breaks down into four logical chunks. Learn these four and the rest is just vocabulary.
Exception type sits at or near the top and names the category of failure. NullPointerException. ValueError. TypeError. IndexOutOfBoundsException. You don't need a computer science degree to get the gist:
- "Null" means something that was supposed to exist, didn't.
- "Type" means the code got handed the wrong kind of data (a word where it expected a number, say).
- "Index" means the code tried to grab an item from a list position that doesn't exist, like reaching for the sixth donut in a five-donut box.
NullPointerException means a missing value, IndexOutOfBoundsException means reaching past the end of a list, IllegalStateException means the program is in a state where this action isn't allowed, ArithmeticException usually means division by zero, StackOverflowError means the plate stack got too tall, often from a function calling itself endlessly, and OutOfMemoryError means the program ran out of room to work with.
Error message follows right after the exception type, same line or the next. It's the one piece of the whole trace written in plain human wording, such as an error noting an expected value type that instead came back null, or a message stating that a particular record was not found." A good message here saves real time down the line. Compare "expected non-empty user ID, received empty string" to something like "Operation failed." One tells you something. The other tells you to go fish. Treat the error message like a headline, not filler text you skip to get to the real content.
Stack frames: each frame is one function call that was active when things went sideways. Every line shows a method name, a file name, and a line number, something like:
at UserService.findById (/app/services/user.service.js:45:11)
Read it left to right: the part before the parenthesis says what the program was doing, and the part inside the parenthesis says exactly where in the code it was doing it. Frames print newest first. Top equals the crash site. Bottom equals somewhere back near where the program first started running. This ordering trips up almost everyone the first time.
Part 4: "Caused by" (chained exceptions). Not every trace has this, but when it appears, pay attention. One error triggered another, and the real story is usually in that second block, not the first. In many languages, an inner exception happens first and then gets wrapped into a new outer exception before being thrown again. If a trace has "Caused by:" anywhere in it, scroll past the first chunk. That's where the plot actually thickens.
How to read the trace: a step-by-step approach for non-engineers
This isn't a debugging tutorial. Nobody's asking a support rep to go fix the code. The goal here is triage: pull the signal out, and hand it off clean.
Step one: read the exception type and the error message first. Together, these two lines usually name the category of failure outright. Copy them exactly, word for word. Don't summarize, don't paraphrase. They belong verbatim in whatever report gets written next.
Scan the frames for anything that mentions your own product. Most lines in a stack trace belong to libraries, frameworks, or language internals, not your company's actual code. Find the first frame that mentions your own package name or file paths. That's usually the closest the trace gets to your team's code, and it's often the most useful line in the whole block. Library frames tend to say things like node_modules, java.lang, or Framework.dispatch. Your own frames will usually have a recognizable word in them: a product name, a domain, an internal service name.
Write down the file name and line number from that frame. This is the single most precise thing a non-engineer can hand over. File name plus line number means the engineer knows exactly where to look, with zero guesswork.
Check for "Caused by" and repeat the whole process on that block if it exists. Exception type, message, first relevant frame. Rinse and repeat.
Describe, don't diagnose. The job here is capturing what the trace says, accurately, not figuring out why the bug exists in the first place. A trace shows where execution failed and the path it took to get there. It doesn't explain why the program ended up in that broken state to begin with. That gap belongs to the engineer, not you.
The trace reads newest-first. Top is the crash. Bottom is the starting point. Reading it backward from how you'd read a story makes it start making sense.
What to do when the trace looks garbled or unreadable
Sometimes a trace looks like it was run through a paper shredder and taped back together by someone in a hurry. That's usually because production code gets bundled, minified, obfuscated, or stripped of debug symbols before it ships. The original function names and file paths get swapped out for short, meaningless strings that mean nothing to a human eye.
Engineers fix this with source maps or deobfuscation mappings, tools that translate the garbled mess back into something readable. That's their job, not yours. If a non-engineer hits a garbled trace, the move is simple: copy it verbatim anyway. Even unreadable output is still useful raw material once it lands with someone who has the right tools.
Async and multi-threaded traces bring their own flavor of chaos, appearing fragmented or interleaved in ways that look broken even when they're not. Same rule applies. Copy it exactly as it appears, and if the trace mentions an async context anywhere, note that too.
A trace nobody can fully read is still worth more than no trace at all. Never throw it away just because it looks like static.
Why non-engineers reading stack traces reduces real work for engineering teams
Every unfiltered error that lands on an engineer's desk costs something. Research on task interruption has found that once someone gets pulled out of a focused task, getting back into it can consume a significant chunk of working time, most of a sprint planning meeting, gone. That's not a coffee break. That's most of a sprint planning meeting, gone, because someone pasted a raw error into Slack with the message "this looks bad?"
Research into developer workflows has found that engineers burn a substantial share of their time on coordination and information synthesis instead of actually writing code. Unfiltered bug escalations feed directly into that number. Every raw error dumped without context is another tool switch, another context reload, another 23 minutes gone.
Stack Overflow's 2024 Developer Survey, with more than 65,000 respondents, found that 61% of developers spend over 30 minutes a day just searching for answers. In a large codebase, a good chunk of that time goes to locating and understanding code that a well-built bug report could've pointed to directly, with a file name and line number already circled.
A Hacker News discussion from March 2025 made a sharper point: stack traces teach you about a product's architecture faster than anyone on the team can explain it out loud. That's not a small thing. The skill compounds. Someone who reads five traces a week starts to understand how the whole system fits together, whether or not they ever write a line of code.
And a trace works as a shared reference. Different people, on different teams, can look at the exact same sequence of events and discuss it without relying on memory or guesswork. That's what makes this relevant to product managers, QA, and support staff, not just the engineering team. Nobody's asking non-engineers to debug the codebase. The point is that someone who can pull the right three pieces of information out of a trace turns a 23-minute interrupt into a five-minute ticket.
What to include in a bug report built from a stack trace
The report doesn't need to be long. It needs to be precise enough that an engineer can start working without asking a single follow-up question.
Six things belong in it, every time:
- The full stack trace, copied verbatim, even if it looks garbled. Never summarize it.
- The exception type and error message, pulled out and placed at the top so it's the first thing anyone sees.
- The first application-owned frame: file name, method name, line number.
- What the user or system was actually doing when the error hit, the action itself, not a theory about what caused it.
- Environment details, if known: product version, and whether this happened in production, staging, or a specific customer's setup.
- A timestamp, pulled from the monitoring tool if one's available.
Two things don't belong. Skip the speculation ("I think it's because...") since that kind of guess can quietly bias how the engineer reads the problem before they've even looked at the code. And skip the suggested fix too, unless there's actual evidence behind it. Otherwise it just makes someone evaluate a guess that never came from the code in the first place.
Picture "something broke in payments" compared with a report with the exception type, the first application frame, the exact action that triggered it, and the raw trace attached. One of those gets picked up in five minutes. The other sits in a backlog getting side-eyed by everyone who scrolls past it.
Attaching the raw trace to a ticket also has a quieter benefit: it preserves the context of the failure for later. Future testing, audits, postmortems, all of it gets easier when the original evidence is sitting right there instead of living in someone's memory of what probably happened.
How code search tools help non-engineers make sense of what the trace is pointing at
Finding com.example.payments.TokenValidator.validate(TokenValidator.java:112) in a trace is step one. Figuring out what TokenValidator actually does, and why it matters, is step two. And step two is exactly where most non-engineers stop and go find a developer to explain it.
Code search tools close that gap. They let someone search across every repository by file name, method name, or symbol, jump straight to the code a stack frame is pointing at, and read its purpose in context, including which team or service owns it. That matters a lot in large, multi-repository codebases, where a single stack frame might point into a shared library that no one person fully holds in their head.
Given that 61% of developers already spend over 30 minutes a day just hunting for answers (per Stack Overflow's 2024 survey), a non-engineer with code search access can skip that line entirely and answer their own "what does this code even do?" question without waiting on someone else's calendar.
Self-hosted code intelligence tools, the kind deployed inside a company's own infrastructure, let people query a codebase in plain language without shipping proprietary code out to some third-party service. That's not a minor detail in an enterprise setting where the codebase itself is the crown jewels.
Reading a stack trace isn't the finish line. It's the entry point into understanding how a whole product fits together, and the tools that support that kind of reading shouldn't be locked behind an engineering title. Everyone on the team benefits from being able to look at the evidence and actually understand what it's showing them.