Using AI to Trace a Data Flow From User Action to Database
AI agents can now map data paths from clicks to databases in minutes instead of hours.
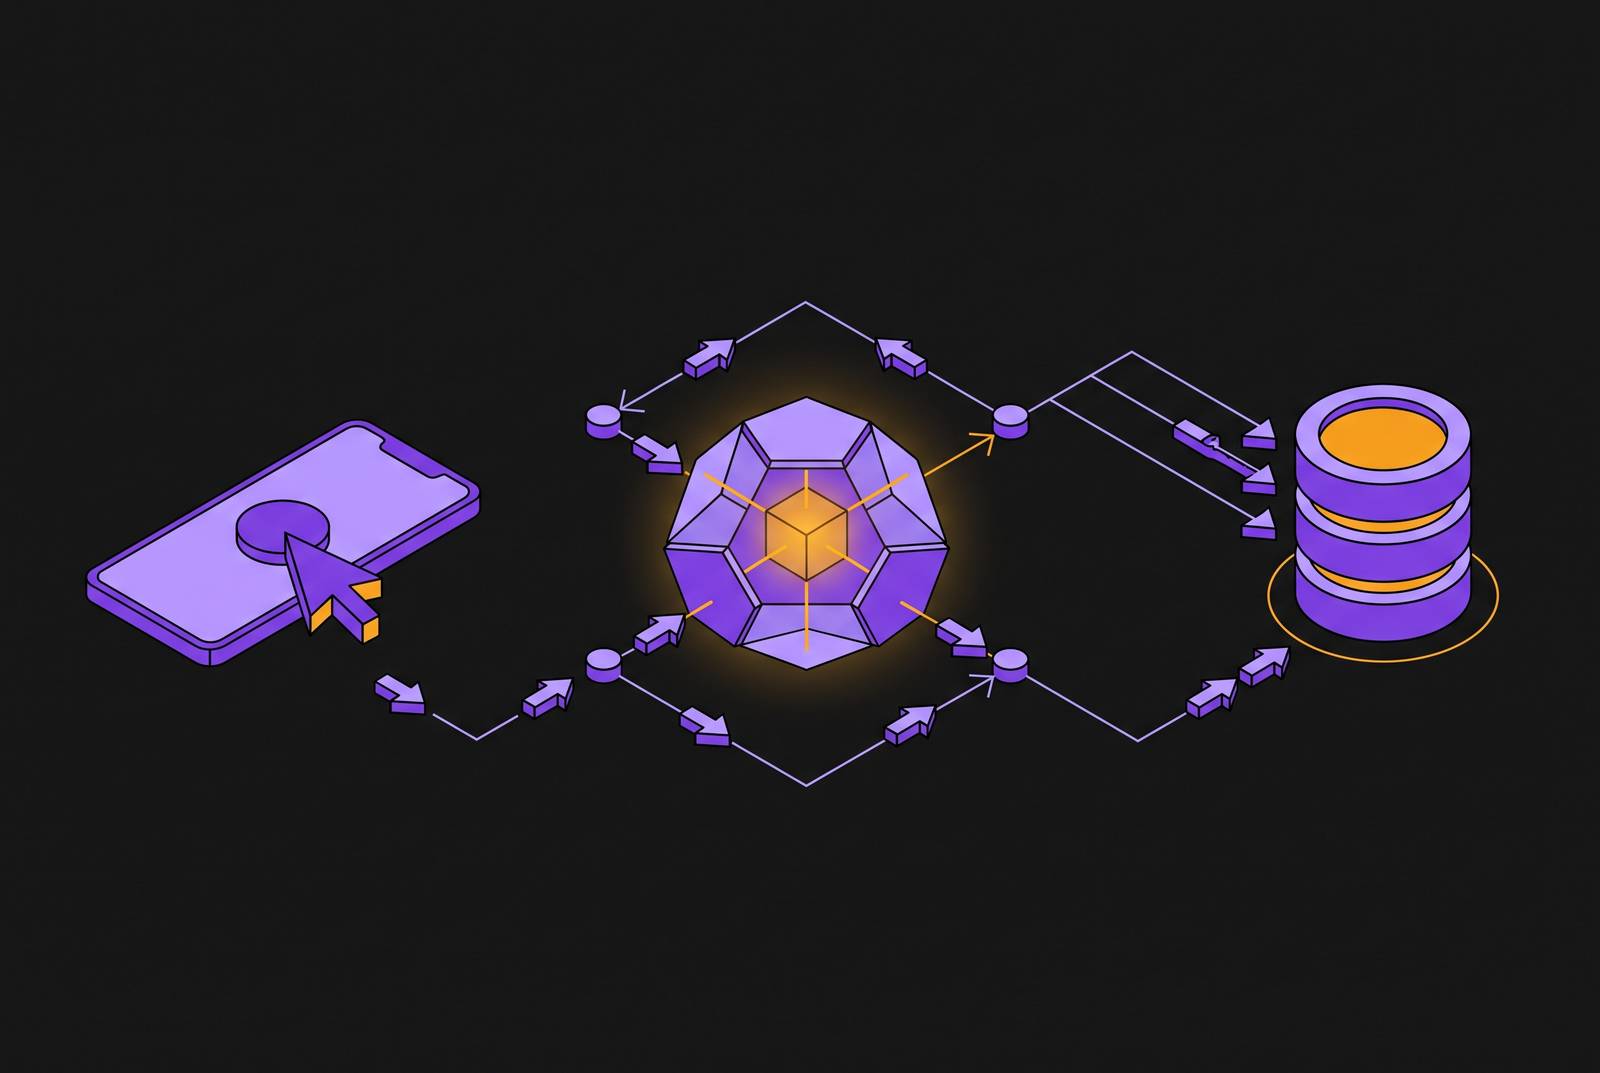
Tracing a data flow from a button click all the way to a database row is one of the most tedious jobs in software engineering, and it's exactly the kind of task AI agents can now handle end to end. Follow "what happens when the user clicks Submit" through four hops (UI handler, API route, service layer, ORM call) and you've mapped the entire path a piece of data takes through a system. Done by hand, that's a multi-hour scavenger hunt across files, repos, and sometimes languages. Done with an agent that actually has full context on the codebase, it's a query you can run in minutes and repeat next week when someone changes the schema.
The chain looks simple written out: click, call, route, service, write. Walking it in a real codebase is where things get messy, and where most engineers lose an afternoon.
Here's why by-hand tracing is painful in the first place. Each hop usually lives in a different file. Often a different repo. Sometimes a different language entirely is involved (one frontend framework calling a backend language that hands off to another worker language isn't exotic, it's Tuesday). There's no built-in tool that connects those dots for you in one shot, so the engineer has to hold the whole chain in their head while jumping between files, and that mental thread frays a little more with every switch.
An AI agent without the right setup hits the same wall, just faster. An agent that opens a brand-new session has no memory of the function someone refactored last week, no idea why a module was deliberately split off from another one three sprints ago, and no record of the argument the team had about that decision. That's not the model being dumb. That's a missing memory layer, and it's the first thing to fix before asking an agent to trace anything.
Fixing it turns a multi-hour investigation into something structured and repeatable. What follows is a hop-by-hop method, not a pitch for AI in general. Each section below maps to one leg of the journey from click to column.
The codebase context problem
A bigger context window is not the fix people think it is. Cognee's research points out that even large context windows can't hold the reasoning behind an architecture decision, the history of why an API got deprecated, or the accumulated pattern of how a team tends to fix a certain class of bug. That's not information you can just stuff into a prompt. It's institutional memory, and text windows aren't built to store it.
There's also the "lost in the middle" problem: information sitting in the center of a long context gets less attention from the model than stuff at the start or end. Stuffing a huge context window every single query is also slow and expensive, so doing it repeatedly for routine tracing tasks doesn't scale.
What actually helps an agent trace data flow is different from what helps it answer a general question:
Relationship-aware knowledge: knowing that process_payment calls validate_card, which depends on CardProvider, isn't something text similarity gives you. That's a graph structure, not a search index. Visibility across repos. If the caller lives in a different repository than the function being called, the agent needs to see both, not just the one it happened to open. An index that stays current: set it up once and leave it untouched, and it becomes actively wrong the moment someone merges a PR. It has to update as the code changes, not sit there stale.
Cognee's research lists five ways teams get burned without this kind of setup: the context window overflows, the agent has no sense of relationships between code entities, it forgets everything between sessions, its index goes stale, and there's no consistent way to query any of it. Fix those and the actual tracing work can start. The next four sections walk the chain hop by hop.
Hop one: finding the UI event handler and the API call it fires
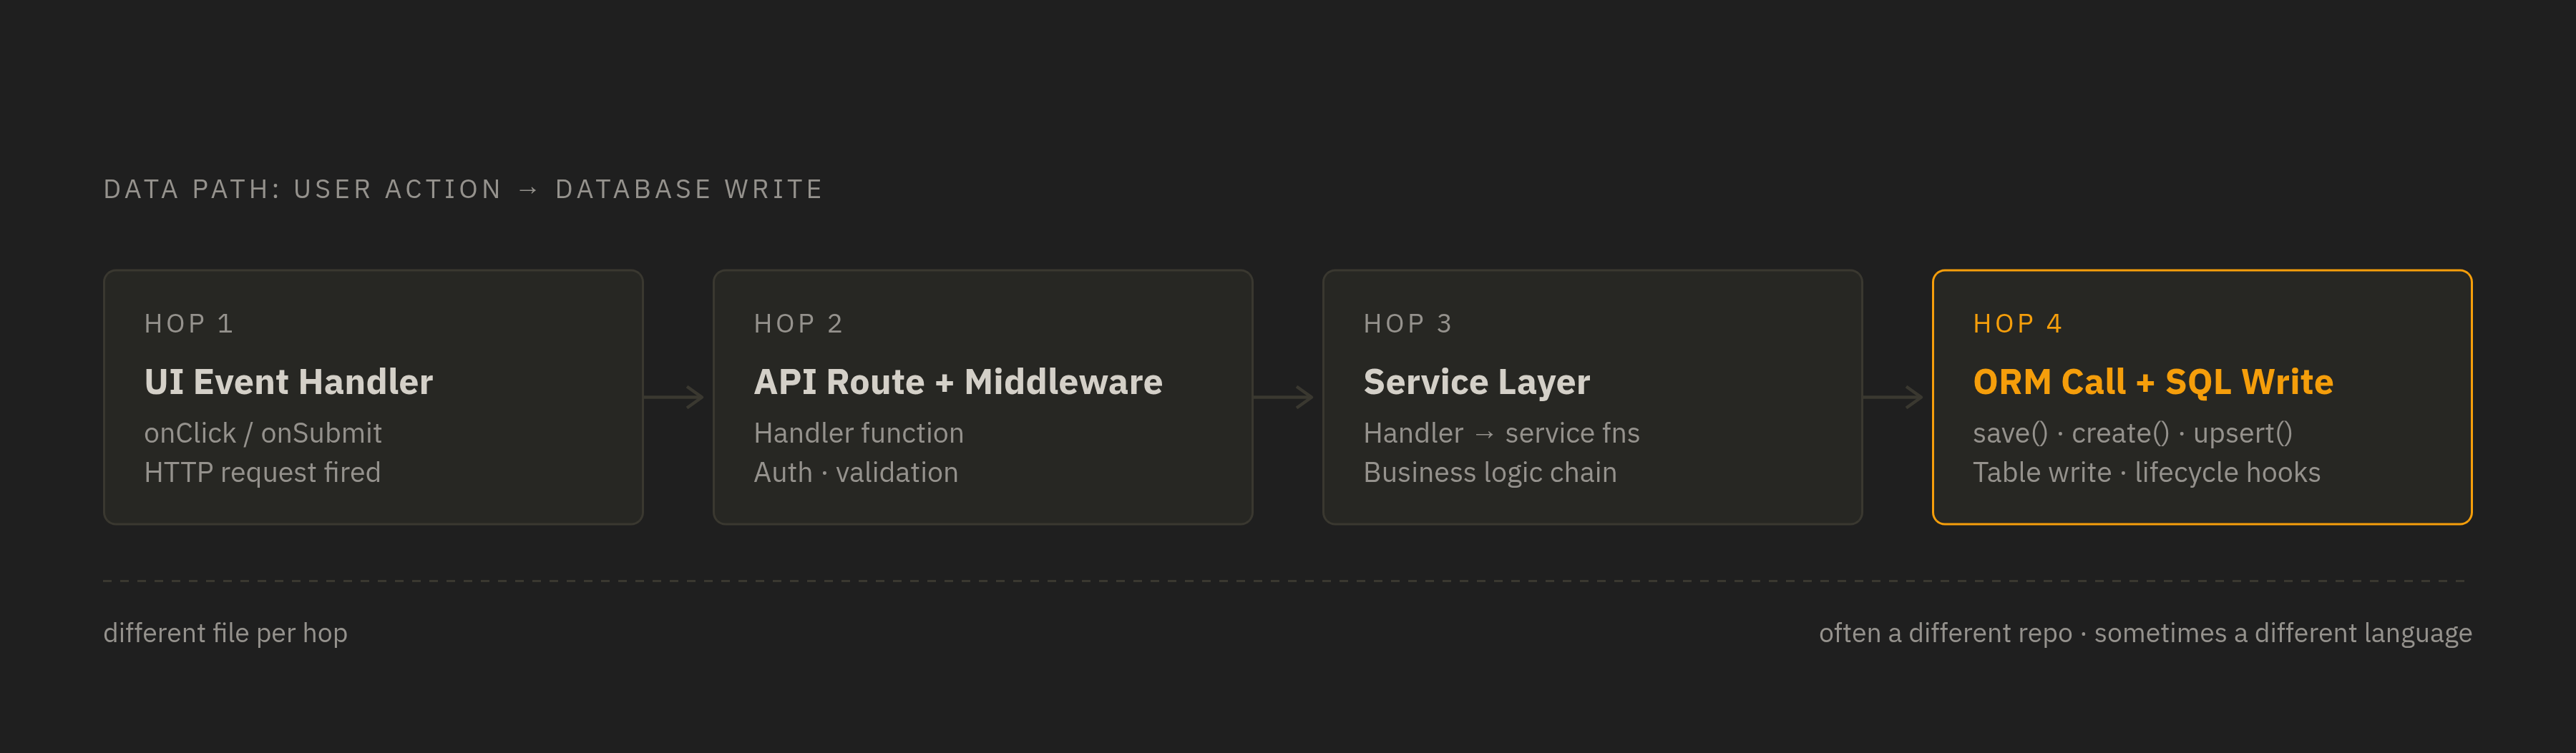
Every trace starts with the same question: what happens when this button gets clicked, or this form gets submitted? At this layer, the agent is hunting for three things: the event binding itself (onClick, onSubmit, addEventListener), the function that binding calls, and the actual HTTP request buried inside that function, its method, its URL, and the shape of what it's sending.
Don't make the agent guess where to start. Name the component or page file directly in the prompt. In Cursor, the @codebase reference pulls in cross-file context, and in hands-on use on a mid-sized TypeScript repo, asking "where is auth middleware wired up?" returned the right files and a call chain that actually held together. Claude Code works the same way in principle: point it at a specific file before the trace begins rather than letting it wander the repo looking for a starting point.
What comes out of this hop is concrete, consisting of the exact function name, the HTTP verb, the route string, and the fields in the payload. Those become the inputs for hop two.
Watch for one specific failure mode here: the agent guessing a route because the name "looks right" instead of actually finding the fetch call. The fix is simple. Ask it to quote the exact line where the request gets made. If it can't, it made the route up.
Hop two: matching the HTTP call to the API route and its handler
Now the trace has to find where that HTTP call lands. In a monolith, this is usually straightforward: one router file, one matching path and verb. In a microservices setup, that same call might be headed to a completely different service in a completely different repo, and the agent needs visibility into that repo to follow it there at all. Route parameters, path prefixes, and middleware ordering can all make what looks like a match actually be the wrong one.
Feed the route string and verb from hop one back into the prompt as explicit inputs rather than making the agent re-derive them. Ask it to find where the route gets registered and name the actual handler function, not just point at a file and call it done. In routers with heavier abstraction (Express, FastAPI, Rails, Spring), ask the agent to walk through how the path prefix gets assembled, so the match can be checked rather than assumed.
Cross-repo tracing is where things get real. If the service that owns the route sits in a separate repository, the agent needs that repository indexed too. This is exactly where a code intelligence setup with multi-repo awareness earns its keep, because without it, the trace just dead-ends at the fetch call.
By the end of this hop, there should be a handler function name, the file and line where it's registered, a list of any middleware running before it (auth checks, rate limits, input validation), and the shape of data the handler expects. That middleware list is often exactly where security and validation logic lives, and it's useful for debugging on its own, independent of the trace. It's often exactly where security and validation logic lives, and it's useful for debugging on its own, independent of the trace.
Hop three: tracing the service layer, what the handler calls and why
This is the hop that actually separates a useful trace from a wall of noise, and it's the hardest one by a wide margin. Handlers almost never write to a database directly. They call service functions, which call other service functions, which might call a utility library or hit an external API before anything gets persisted. Add conditionals, feature flags, or an async queue into the mix, and one handler can have three or four different paths depending on what the user actually did.
The fix is specificity. Give the agent the handler name and the exact scenario being traced ("the user is logged in and submitting a new payment, not editing an old one"). Skip that detail and the agent will happily trace every branch at once, which turns a clean chain into a tangle. Ask for a call chain, not a summary: function A calls B calls C, spelled out so each link can be checked against the actual code. Where the logic forks, have the agent label each branch and say which one actually reaches the database.
Three patterns tend to trip agents up at this layer:
Dependency injection. The concrete class doing the work may not be visible at the call site at all, so the agent has to resolve which implementation actually gets injected. Event-driven dispatch. If the handler just publishes to a queue instead of calling a service directly, the trace has to jump to whatever's listening on the other end, which means finding the event name and the subscriber that picks it up. External API calls. If the service layer's next move is a call to some third-party API instead of a local write, that may be the end of the line for a database trace in this repo, and that's fine to report as the answer.
The output here is a straight line from handler to the function that finally makes the database call, with every fork labeled and the chosen path explained, not just asserted.
Hop four: the ORM call and what it writes to the database
Last stop. Here the agent needs to identify the actual ORM call, one of save(), create(), update(), upsert(), a raw SQL statement, or a query builder chain, along with which model or entity it's operating on. It also needs to map which request fields feed which database columns, and flag any hooks or lifecycle callbacks that fire on the write (before_save, after_create, and the like), since those can quietly change what actually lands in the table.
Not every engineer reading the trace speaks fluent ActiveRecord or Prisma, so ask the agent to translate the ORM call into its SQL equivalent. ActiveRecord, SQLAlchemy, Hibernate, Prisma, TypeORM: each one has its own convention for mapping a model definition to actual column names, and the agent should be the one resolving that, not the reader.
If migration files or a schema definition are available, have the agent cross-check column types and constraints against what's actually being written. That single check surfaces type mismatches and nullable-field issues that are easy to miss just reading application code.
The final output at this hop is the table name, the list of columns touched, the SQL equivalent of the ORM call, and any write hooks that fire. Put it all together and the full trace reads as one continuous chain: UI event handler, HTTP call, route plus middleware, service call chain, ORM call, SQL write, each step named and pointing at an exact file. That's the artifact: a chain someone can actually check, not a paragraph of prose. Not a paragraph of prose, a chain someone can actually check.
The context infrastructure that makes multi-hop tracing reliable
None of the four hops above work reliably if the agent has to reinvent its access to code at every step. Each hop needs a different file, frequently a different repo, and without a standard way to plug into that, the agent ends up making one-off tool calls and losing the thread between hops.
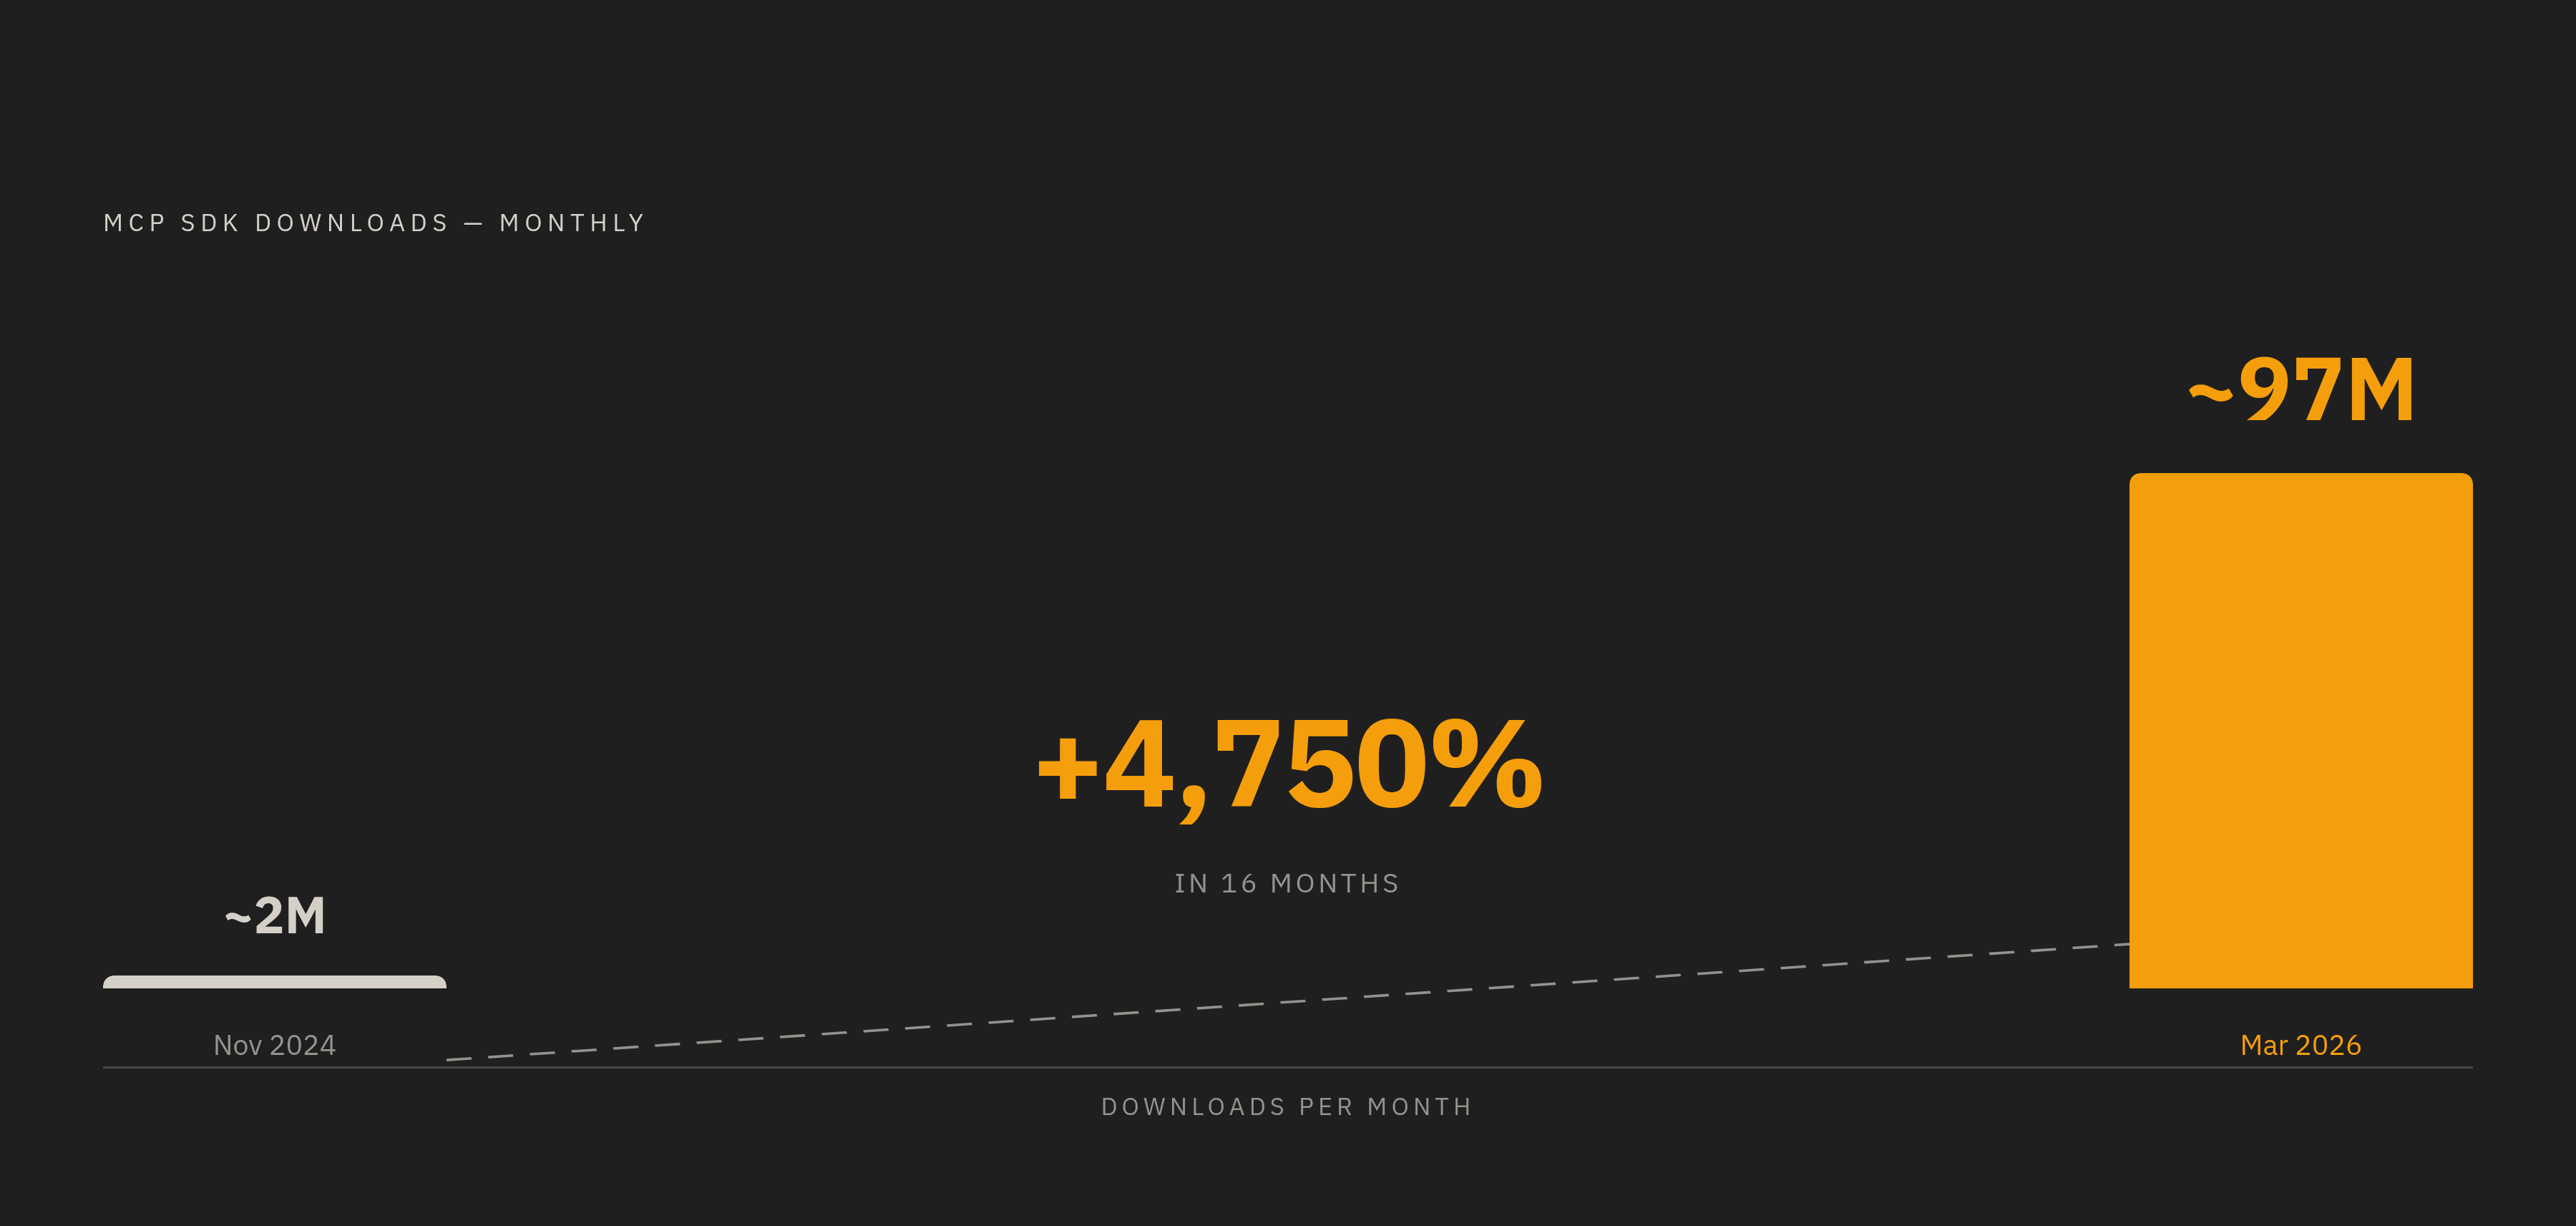
MCP (a protocol for connecting agents to outside tools and data, released by Anthropic in November 2024 and handed over to the Linux Foundation's Agentic AI Foundation in December 2025) has become the standard way agents connect to outside tools and data. The growth curve tells its own story: from roughly 2 million monthly SDK downloads at launch in November 2024 to about 97 million by March 2026, a jump of roughly 4,750% in 16 months. The ecosystem an agent can plug into is not small, and it's not slowing down.
Three pieces of MCP matter directly for this kind of tracing:
Tools, which are executable actions, like the agent calling a search function to find where a route gets registered. Resources, read-only data fed into context automatically, like schema files, migration history, or architecture docs. Prompts, reusable templates: the exact four-hop method described above can be saved as a template so the agent runs the same process every time instead of improvising.
For companies with sensitive code, the MCP server exposing search and navigation tools should run inside the company's own infrastructure, full stop. Code shouldn't have to leave the building to get indexed. From there, connectors built on MCP can pull in tools like Jira, Linear, or Confluence, so an agent tracing a payment flow can also pull the original ticket's requirements alongside the code, all without either one touching an outside cloud service.
A knowledge graph built from AST parsing produces this durability: functions, classes, modules, and the typed relationships between them, tracked as a structure rather than a pile of text. That's what survives between sessions and updates incrementally as the repo changes, instead of going stale the week after it's built.
Scoping an agent's permissions to a single task session means access expires automatically when the task ends and a human has to sign off before a new session opens. For a trace running through payment or authentication logic, that kind of boundary requires stricter enforcement: access should expire automatically and a human should sign off before a new session opens, more so than for a routine bug fix.
Choosing the right agent for data-flow tracing tasks
Claude Code works across the terminal, an IDE, a desktop app, and the browser, and it can read a repo, edit files, and run commands directly rather than just answering questions about code. Claude Opus 4.6 has a reported SWE-bench score of 80.9%, a real-world benchmark for how well a coding agent handles actual software tasks rather than toy problems.
For anything touching payment or auth flows, permissions are set per tool and per command, with allowlists you configure yourself, and PreToolUse hooks step in to check every action before it actually runs. As an MCP host, it supports project-level config (.mcp.json, checked into git), user-level config (~/.claude/settings.json), and remote HTTP servers as a transport option, which makes wiring in a code intelligence server fairly straightforward. Pricing as of mid-2026 runs Pro at $20/month, Max 5x from $100/month, and Max 20x at $200/month. AI-attributed commits in the tracked project set climbed from 1.6% of non-bot activity in December 2025 to 6.7% by March 2026, and Claude Code accounts for half of that AI-attributed commit volume.
Cursor is built into an IDE (a VS Code fork) and keeps a remote vector index of the repo, with embeddings stored in Turbopuffer, so the @codebase reference can pull relevant files into any question regardless of where they sit in the project. In hands-on use on a mid-sized TypeScript repo, asking "@codebase where is auth middleware wired up?" returned the correct files and a call chain that held together end to end, which lines up directly with the work required at hop two of this method.
Both tools solve a version of the same problem: getting an agent past the fragment it happens to have open and into the full structure of the codebase. The four-hop method holds regardless of which one runs it. What matters is that the agent isn't starting from zero at every file boundary.